www.eia.doe.gov/
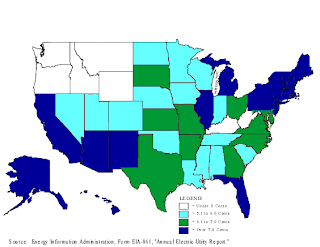
A statistical map uses mostly colors and shading in order to portray the statistical breakdown of information it is targeting. The map is usually broken down into separate units with colors that correspond directly to a stat key to indicate what the colors mean. In this statistical map of the United States, average revenue per killowatthour is shown and relates to a key to indicate the differences in each state.
No comments:
Post a Comment