 www.physics.csbsju.edu/
A boxplot is graph that shows groups of numerical data. It shows central location, average, and measures of dispersion. Above is an example of a boxplot.
 www.physics.csbsju.edu/

 http://addictedtor.free.fr/graphiques/RGraphGallery.php?graph=76
 www.climate.washington.edu/
 www.washburn.edu/.../
 camellia.shc.edu/.../
 psyc.queensu.ca/
 www.techmind.org/

 www.leelasstudio.com/html/frenchisee_decesion...
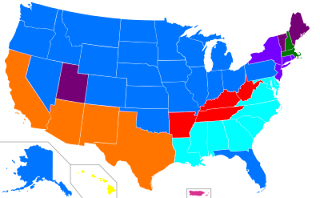
 en.wikipedia.org/wiki/American_ancestry
 www.cdc.gov/pcd/issues/2007/oct/07_0091.htm
 www.geocities.com/stevejford/new_page_2.htm
 http://www.d.umn.edu/geog/cartfolder/HTML%20Pages/Map-Types.htm
 www.humboldt.edu/.../350_maps_airphotos.html
 www.tccycling.com/reports/tahoe/stanford-paig...
 www.weathernotebook.org/features/winters.html
 pubs.usgs.gov/.../
 www.irrigation.gov.mm/


 www.salomonkroonenberg.nl/wetenschap.html
 http://wdssii.nssl.noaa.gov/geotiff_new/
 www.3dnworld.com/
 www.poorandstupid.com/2004_11_07_chronArchive.asp
 mundi.net/maps/maps_014/


 www.mulchblog.com/
 fanonite.org/2008/02/
 www.maps.com/
 en.wikipedia.org/wiki/
 www.nscb.gov.ph/.../
